UX metrics that actually make it into the exec deck
Anyone can ship now. The question is whether it made money. Here are the UX metrics that answer that, and the math to use when you don't have clean data.

"We're shipping faster than ever."
Cool.
But how much of what we're shipping actually makes money?
That's the question sitting underneath every design review now. The time it takes to build has collapsed. The quality of the thinking behind it hasn't. So teams are shipping more things that feel right, and a lot of them don't get used, don't drive an outcome, and don't change anyone's behavior.
Just more shit in the product.
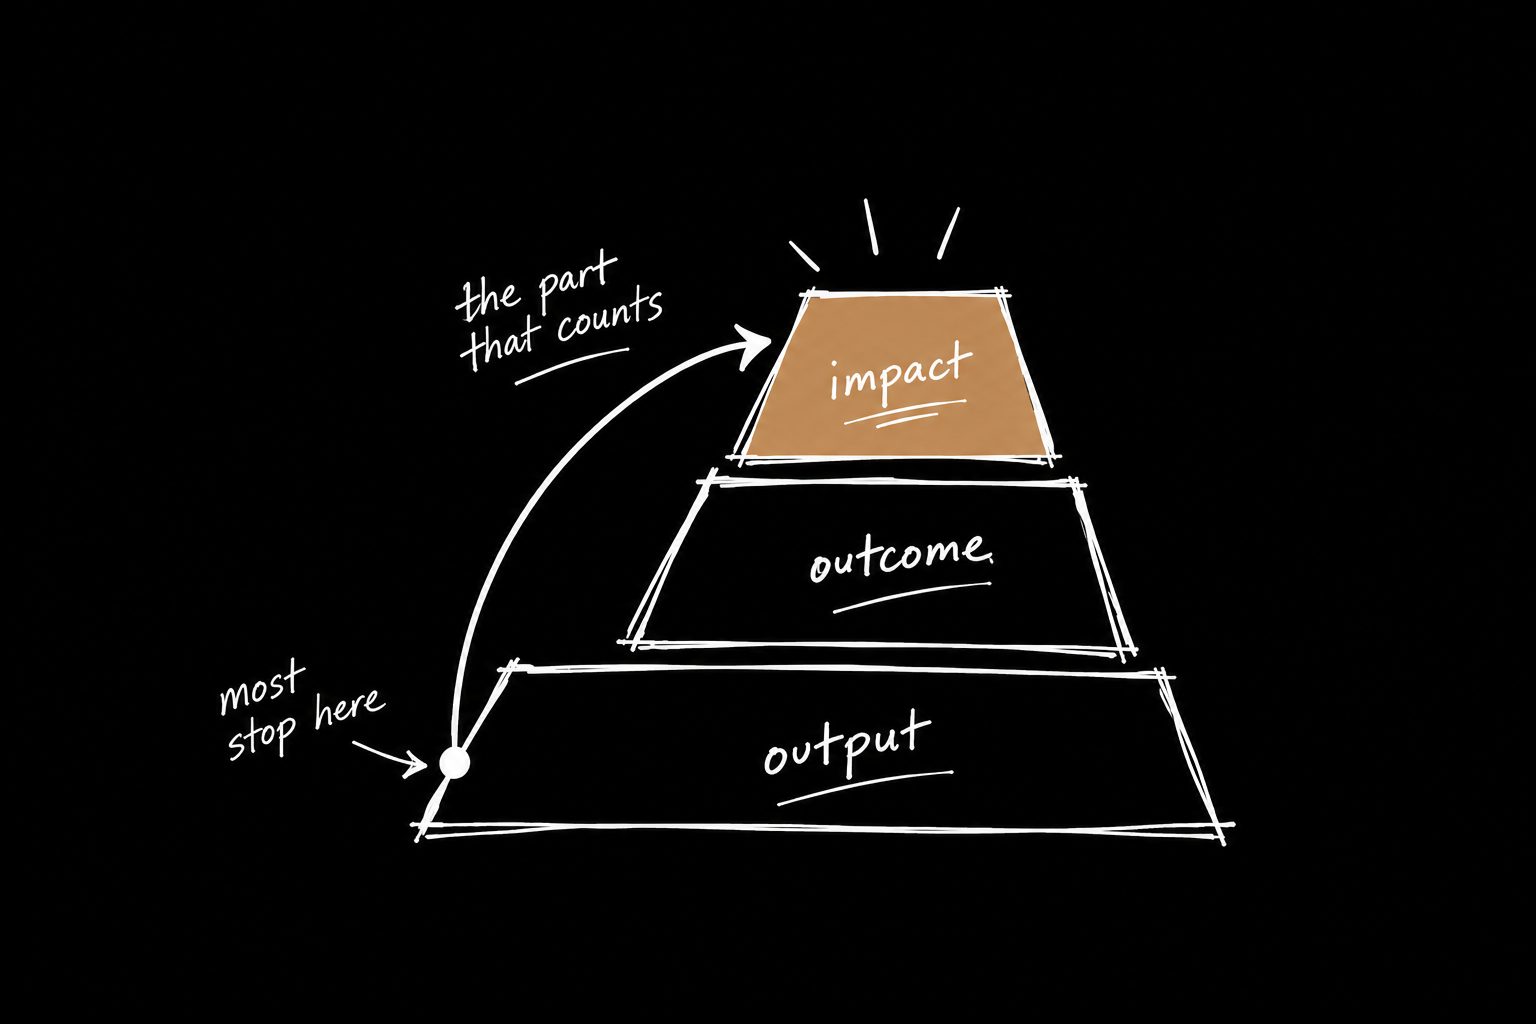
The way out is measuring the right things. Not the things that are easy to count. The things leadership already cares about.
Why most UX metrics never make it into the exec deck
Because they answer a question nobody upstairs is asking.
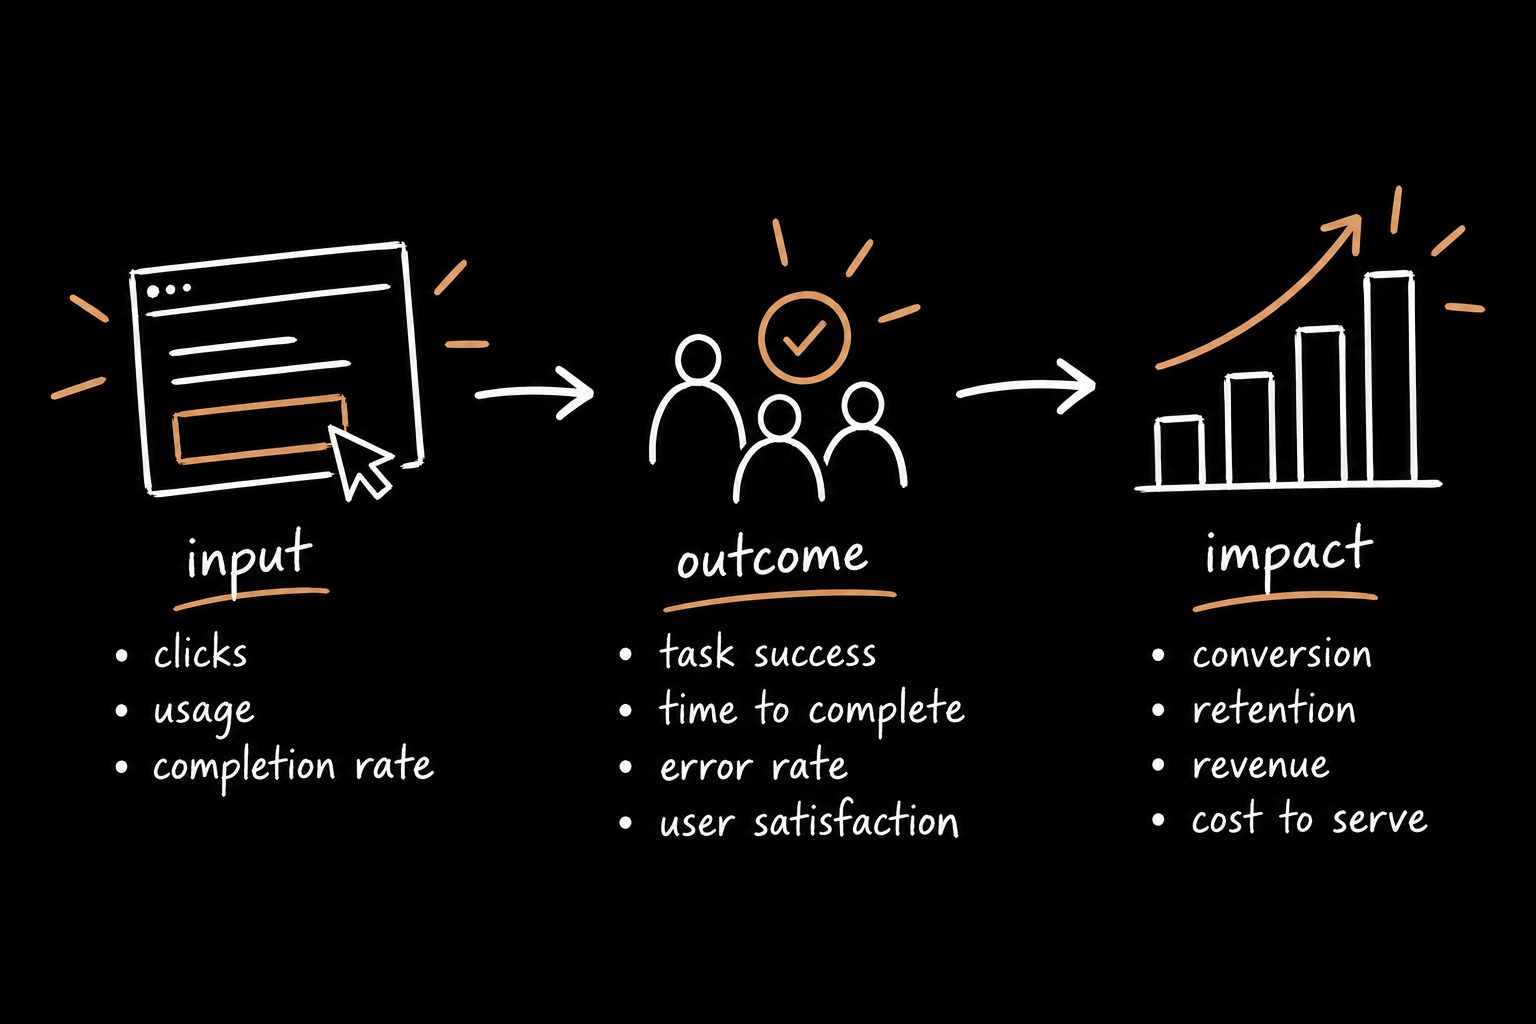
Clicks. Time on page. "Users loved it" from five interviews. NPS with no link to anything. They're not wrong. They just don't connect to revenue, retention or cost, so they get politely ignored. Nobody upstairs gives a shit about time on page.
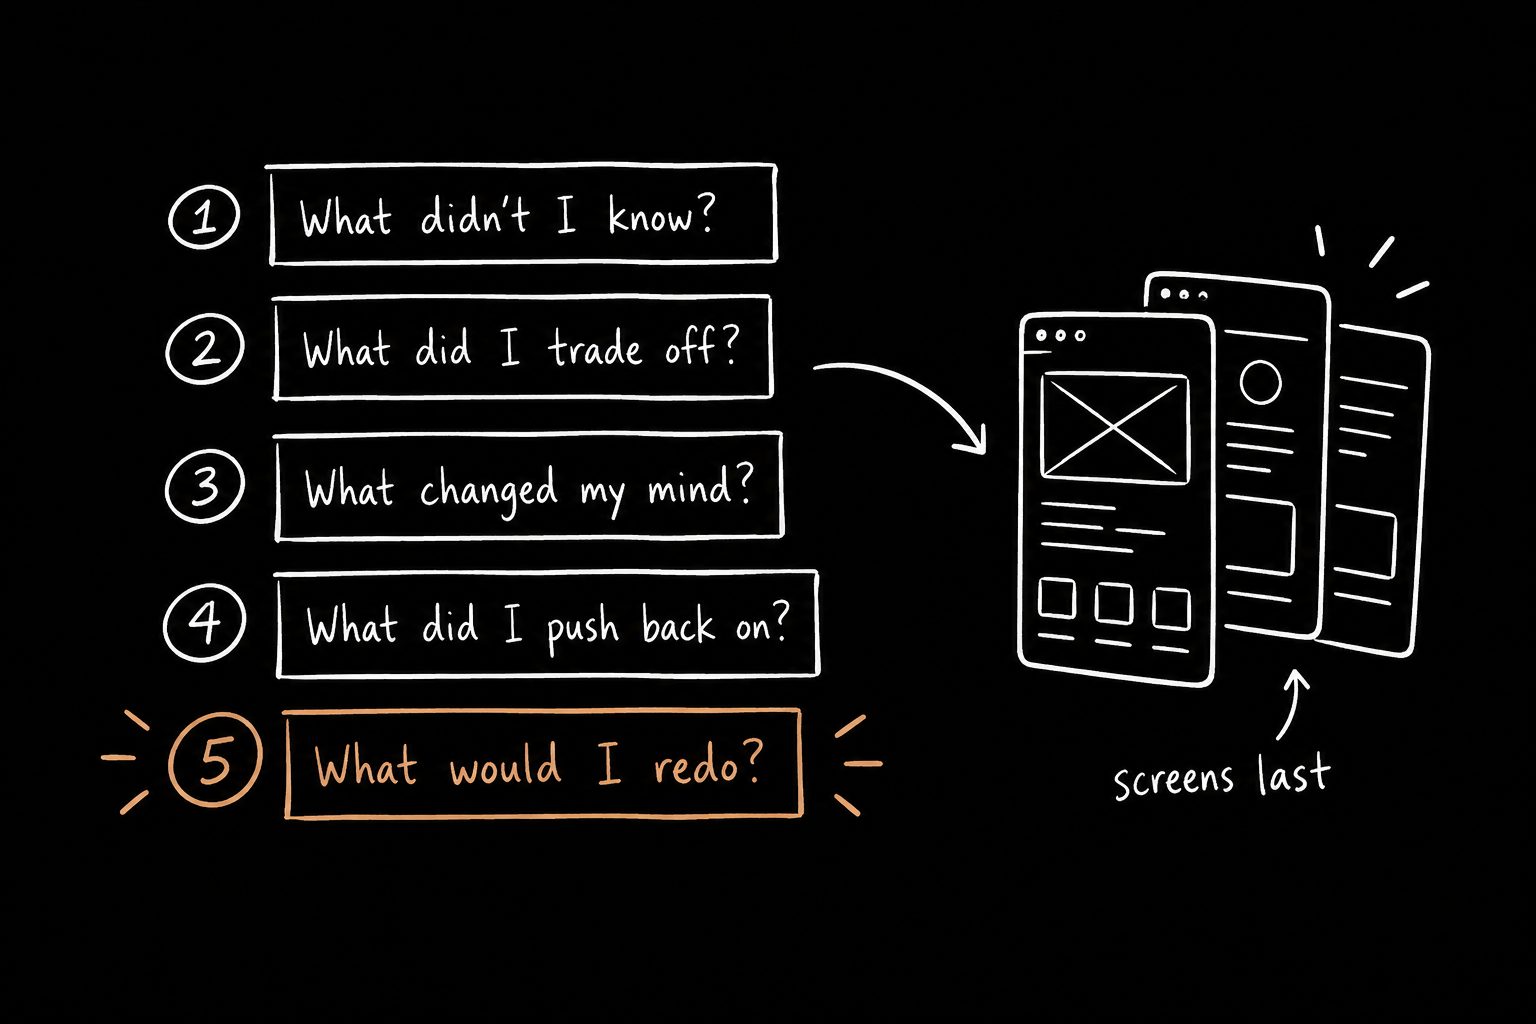
And here's the gap nobody likes admitting: you can't state an outcome you never measured. Most weak case studies aren't a writing problem. They're a measurement problem that showed up late.
The fix isn't more metrics. It's translating the ones you have into the four things the business runs on.
The four kinds of UX metrics leadership cares about
| Category | What it tells leadership | UX metrics to track |
|---|---|---|
| Adoption | Are people actually using what we built? | Feature adoption rate, activation rate, time to first value |
| Retention | Do they keep coming back? | Weekly active users of the feature, repeat usage, churn reasons tied to the experience |
| Efficiency | Is it costing us less to run? | Task completion time, support tickets per feature, demo and onboarding time |
| Revenue | Is it making or protecting money? | Conversion rate, trial to paid, expansion, deals unblocked |
Every UX metric you track should sit in one of those rows. If it doesn't, ask what it's actually proving.
The adoption metric everyone forgets
A feature ships. The work is solid. The UX makes sense. Everyone moves on.
Then a week passes.
Usage is lighter than expected. People ask what changed. Support keeps explaining the same thing. Sales keeps walking through the same screens. Adoption technically exists, but it never really takes hold.
This is where a lot of good design quietly dies. Not at launch. After it.
Most products don't fail because the interface was bad. They fail because the change never became part of anyone's routine. So the first metric to watch after launch isn't satisfaction.
It's whether people come back to the feature in week two.
How to estimate impact when you don't have perfect data
You don't need a data team to reason about impact. You need conservative math.
Say a feature takes 10 minutes to explain in a demo or a support conversation:
- 20 explanations per week
- 10 minutes each
- 200 minutes per week
- about 13 hours per month
At a conservative $75 an hour, that's roughly $1,000 a month in explanation cost. For one feature.
That's not fluff. That's math.
Reduce that by even 25% and it's real money and real time returned to the team.
Here's the important part: you're not claiming results. You're showing expected impact. Label it clearly, show your assumptions, and keep the numbers conservative. Leadership trusts a modest estimate with visible math far more than a big number with none.
UX KPIs vs UX metrics
People use these interchangeably, but there's a useful difference.
A metric is anything you measure: task time, error rate, clicks.
A KPI is the handful of metrics you've agreed matter most for this initiative, with a target attached.
Most teams track plenty of metrics and agree on zero KPIs. Pick one or two per project, write the baseline and target down before you build, and you've got something to report.
The best place to do that is the PRD's success metric section. Here's the PRD template I use, which puts the metric, baseline, target and timeframe right at the top.
UX metrics to stop leading with
- Clicks and page views. Activity isn't value. A hamster on a wheel has incredible engagement numbers.
- Time on page. Longer can mean confused.
- Raw NPS. Useful context, weak proof, unless it's tied to a behavior.
- "Usability improved." Improved how? By how much? For who?
Keep them as supporting detail. Just don't lead with them.
How to put UX metrics in a case study
A metric with no story is a number. A story with no metric is a vibe.
Put the number at the moment it explains the decision you made. "We cut the step where mobile buyers gave up" lands harder with the drop-off number right there than with it saved for a results slide at the end.
I go deeper on structure in UX case study examples and the fill-in-the-blanks UX case study template.
Influence comes from small, clear wins
This is the part nobody tells you.
Influence doesn't come from big redesigns or calling yourself strategic. It comes from small, measurable wins. You improve one step in the funnel. You remove friction at the exact moment someone was about to drop off.
Someone sees it and goes, "wait, that actually made a difference."
Then, "can you look at this too?"
That's how your surface area grows. You stop designing screens and start helping the product make money. It's the thread that runs through every issue of The ROI of Design newsletter.
If you've got a project where you know it mattered but can't say how much, The 15 Minute Case Study is a free Claude Skill that walks you through finding the number, or finding out you never measured it. Either way you'll know.
UX metrics FAQ
What are the most important UX metrics?
The ones tied to adoption, retention, efficiency or revenue for the specific feature you shipped. For most B2B SaaS features, start with feature adoption rate and repeat usage in the first month.
How do I measure UX without analytics tools?
Use support ticket counts, demo time, sales call notes and a few user sessions. Combine them with conservative math and label the result as expected impact.
How many UX KPIs should a project have?
One or two. More than that and nobody remembers what success was supposed to mean.
When should I define success metrics?
Before you build, in the kickoff. If you wait until after launch, you'll pick whatever number looks best, and everyone will know it.